Digital Audio Sampling Theory
This article explores some basic principles of digital audio that surround the creation of linear PCM digital recordings. The inherent strife and inefficiencies of digital sampling have presented mathematicians and computer people with plenty of work to do ever since the days of Harold Nyquist. The results are pretty good for simply listening these days, but that is only after a lot of fixes, and, there is still a lot of work to be carried out to attain true fidelity. It is mistakenly accepted by many in the consumer market that the output of a digital-to-audio converter exactly matches the digital data. It doesn't. And here, we begin to find out what makes the difference. Some of the fundamental concepts include oversampling, aliasing, antialiasing filters and smoothing filters. Without these processes, linear PCM digital recording and playback would remain of academic interest only. With them, and other techniques, it's pretty good.
Basic Issues
If you didn't know, the sampling rate for CD format is 44.1 kHz. For a while there was a competing standard known as Digital Audio Tape or DAT. The DAT format, was 48 kHz. (These sampling frequencies, along with 32 kHz, form a set of standard rates approved by the Audio Engineering Society way back in 1985). Other standard rates are simply divisors or multiples of these. The main purpose of such standards is to establish formats that will deliver audio of a quality acceptable in specific situations, without the unnecessary overhead of outputting hundreds of thousands of bytes per second that won’t add value. Obviously, the higher the rate, the better the quality. But some applications, such as a speech recording for information purposes, have a limited quality requirement, and therefore, only demand a moderate amount of CPU time.
If you compare 44.1 kHz with 48 kHz by means of appropriately similar recordings, then in the CD format, cymbals and snare drums stand out just a little too much and sound a little less than natural, dogged by synthetic-sounding noise. That’s if your hearing is like the day you were born. This noise follows the enveloping characteristics of the original, and is the result of sonic artifacts whose generation is inescapable in digital recording. The overall tone, if you listen closely, also has just a touch of the "fatness" more familiar in lower sampling rates. This is literally the effect of a low-pass filter on a synthesizer, but with a very high cutoff frequency. 48 kHz though only a slightly higher sampling rate does not make so much of a humanly appreciable display of these phenomena. To most listeners for casual listening purposes, CD seems perfect. Yet, if you are not simply a listener, but an engineer to whom the fidelity of the audio spectrum is of importance - especially if you plan to slow down a recording by a considerable factor - then a far higher sampling rate is desirable. Any serious sound card or recording device allows much higher sampling rates. It is only with a very high sampling rate that you can slow down or drop the pitch of a recording without a bit crushing type of effect that absolutely ruins the sound.
The above hints at another concern for engineers: the bits-per-sample resolution. If you compare 8 bit sound to 16 bit sound then you will notice the difference in the complexity and accuracy of the sound, not to mention all the background hiss and crackling at the tail end of amplitude fades. For listening purposes only, a resolution of 12 bits is just satisfactory as long as the amplitude in terms of sample values remains high. But consider the case of a forensic audio specialist or a field researcher who wishes to amplify a section of a recording that is humanly inaudible. At 16 bit resolution, such an amount of amplification will result in a similar case to the noisy, crackly, low resolution sound, characteristic of 8 bits, or something even worse than that. The foregoing suggests that a reasonable result may be obtained in 16 bits if the amplification required is anything up to a factor of 16 (ie: 4 bits). This is quite a good dynamic range to be able to play with. But sometimes it might not be enough. If the original recording was made at a much higher resolution, such as 24 bits or 32 bits, then these inaudible sections could be amplified by a factor of up to 65536 (ie: 16 bits) and still yield nice, lovely 16 bit resolution! This would suggest then, that the CD format is clearly a format for listening purposes, and not for serious audio processing. It is commonly accepted by sound engineers, though, that a final mixdown should be at 24 bits resolution because the detail of the sound is optimal for high fidelity mixing and mastering. This author recommends that individual tracks recorded at a reasonable volume can be at 16 bits resolution to avoid unnecessary disk space being taken up.
Early Days
Going way, way back, the first digital audio format was developed even before digital computing made its debut in the early 1950's. According to Roads, British researcher, A. Reeves, in 1938, patented a system for the transmission of messages in an "amplitude dichotomised, time-quantised" format. This, he called Pulse Code Modulation (PCM). PCM is what we have been referring to above and is the simplest of audio formats. It is simply a quantised representation of an audio wave. It is not compressed in any way and in that sense features no loss of sonic content. In reality, losses occur because the sampling rate (time period of quanta) and the resolution (bits per sample) are finite and give discrete integer values, while the original sound waves in the air are of a mathematically continuous nature. There are always audio components too small or of too high a frequency to be represented in a PCM recording.
Some ten years before the work of Reeves, the first seminal paper on sampling theory was published by a man whose name now appears all over writings on digital audio. Harold Nyquist, of Bell Telephone Laboratories, gave us the building blocks on which sampling and playback technology has been built. While his theorem has a forerunner in the work of mathematician, Augustin Louis Chaucy (1789 - 1857), one aspect of Nyquist's work has been held in such high esteem that his successors have planted his name on it ever since. It is the concept of the Nyquist Frequency. This frequency is simply one half of the sampling rate that is in use, and is the very highest frequency that can be represented in a digital recording. The Nyquist frequency for CD's, then, is 22050 Hz, and for DAT's it is 24000 Hz.
The Beginning of Sorrows
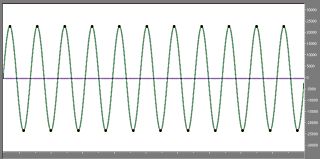
The common version of the story is that you can record and play back any wave frequency from 0 Hz up to the Nyquist Frequency in a digital system whose audible output is simply a series of quanta. The fact is that the relationship between the digital wave and the output analog signal is somewhat more complex - and that is the real point of this article. But let's for now take this regular layman's view. (Just to be arrogant bastards for a while). This is possible in specific circumstances where interference is minimal. By interference we mean a range of things, both intrinsic to the wave component (ie: a sinusoidal wave at a specific frequency within a more complex wave) and extrinsic to it: the context in which it is found. It would be helpful to begin with the very simplest possible case of these inadequacies. If you have a wave editor, then perhaps you will wish to perform a simple experiment. Generate a cosine wave (a sine-like wave at 90 degrees phase, meaning it starts at the zero--value baseline, so there is no initial click), the frequency of which is precisely the Nyquist Frequency (RNq), with any sampling rate (RS) you care to use. Zoom in.
What you will see is a nice, symmetrical set of samples occupying opposite sides of the oscilloscope window. They are probably visibly joined by a sinusoid line. If you play the wave a good DAC can produce the soundwave that you see on screen through using oversampling and a smoothing filter, in the same way that you see pixels between the black dots in these diagrams. A cheaper, older DAC will produce simply a series of quantum steps matching the sample values. A soundwave with a stepped shape.
Now repeat the experiment using a sine wave (at 0 degrees phase). What you should now obtain is a flat line. This is because the relationship of RS to RNq is such that the wave level happens to be zero every time a sample is generated (or taken, if the wave was recorded). The result is silence, regardless of whether you have oversampling or not. The digital system has created data very different to the original mathematical formula. The same applies to recording very high sound frequencies. Yet the only difference between these two instances is the phase.
The above is a conflict of relative frequency with relative phase. Therefore, if you record at 44.1 kHz, then you can only get the RNq to record at a proper level if it just so happens to be perfectly in phase with the action of the ADC. Other phase values will still permit the representation of a sinusoid, but will force it to be rendered at less than the intended amplitude. This is because the samples reside not at the peaks of the actual wave (or a sinusoidal wave existing theoretically as a component within
a more complex wave) but on the slopes. The fact that they are extant on wave slopes means nothing to the computer: as long as they are the maximal quanta, they are enforced as peak values. For reason of the use of integer sample values, the frequency response of a digital recording is highly unstable at higher frequencies, and it is so to an extent that make all analog recording methods look much better. Higher sampling rates can address this for the intended purpose, but it is necessary to be aware of this so that appropriately sophisticated equipment can be selected. This is with respect not only to phase, but also, as we see below, with respect to frequency.
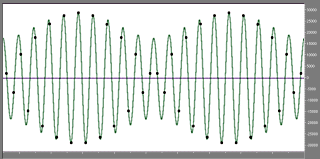
Quite another effect can be created by waves whose phase may be acceptable, but whose frequency is not a simple divisor of the sampling frequency. The samples fall on slopes of the original wave but to the hardware these represent peaks and troughs. As the position on the slope changes for each sample, the implied peaks and troughs change in amplitude. An amplitudinal pattern emerges, where samples that appear to represent peaks and troughs are of a lower amplitude than others, even in a steady-state wave. These, of course do not actually represent peaks and troughs, but slopes. Nevertheless, in certain circumstances, where neighboring data do not bear the correct promptings for the hardware, the output will follow much the same amplitudinal pattern. This rapid modulation creates its own sound - an inharmonic artefact whose pitch is equal to the modulation frequency, and which in a complex sound may, if present, come out as background noise. The accompanying
figure shows an example of this. The wave frequency is in a ratio of 1:2.1 to the sampling frequency, and was generated at a constant amplitude of -1 dB. A lower frequency comes through due to the rapidly changing volume as shown in the diagram. In addition there is something even more striking. The curved line between the sample points is a rough representation of a smoothing filter. The wave is a cosine, but it appears to be a sine due to the impossibility in defining peaks, troughs and baseline crossings precisely. The mathematics of making a smoother wave out of the recorded sample values does not allow for the frequency to be recorded and reproduced precisely. In short, we have a mangled recording in the very high treble band. At lower frequency bands which we all hear better, this problem is so minute as to be negligible. But it is because of these sonic transmogrifications that a very sensitive listener will notice the hissy, synthetic quality that cymbals and other sharp percussion get on a CD standard recording.
The above argument should demonstrate the difficulty involved in translocating sounds to and from a digital system and the real world of microphones, speaker cones, of atmospheric vibrations, of eardrums and of people and instruments. A sampling rate required for smooth digital audio in the high treble band is something extraordinary, which makes the original CD standard, and the way it was once idolised, very inadequate. We need some sort of go-between function hard-wired into the playback device that will connect up the sample values and smooth the contour of the digital wave. We need to eliminate the possibilities of frequency and phase conflicts, and the generation of other artefacts, at any audible frequency. Imagine having data for output that, regarding high frequencies, shows not simply peaks and troughs, but actual wave contours or vectors. Or we can just keep on using smoothing filters.
The Smoothing Filter
The popular version of the story, as we stated above, is that a digital system may output, at the original level, any wave frequency from 0 Hz up to the Nyquist Frequency. The sinusoidal line that we noted above works similarly to a real smoothing filter. It joins the dots, so to speak, and makes a more realistic picture.
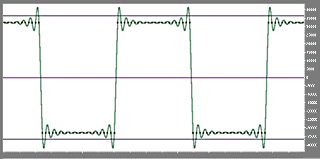
The stepped quanta are small enough to avoid high frequency artefacts that matter to us. The smoothing filter is basically mathematical guesswork and is therefore not
perfect in its restoration of the losses made through sampling. It can, in fact make mincemeat out of simple, geometric waves like the square wave depicted here, at very high frequencies. Generally speaking, such a wave will come out dog-eared and rippled where sharp corners occur. But mostly it is pretty damn good with natural sounds.
Aliasing and Anti-aliasing in High Treble Recording
Let's now move from playing audio data, to recording it. What would happen if you converted an audio signal directly to digital, assuming that some of the content was of a higher frequency than the Nyquist frequency in operation? At a mathematical level, the answer is audio barbarism. What happens is that the Nyquist frequency acts in a refractive manner, so that wave components whose frequencies are above it are mapped to lower frequencies. These new, lower pitched components are the same distance, in frequency, from the Nyquist as their higher pitch originals were. Obviously, the result can sometimes be a mass of inharmonic interference. This phenomenon is known as aliasing.
The means to prevent aliasing is to introduce an anti-aliasing filter between the audio input and the analog-to-digital converter (ADC). That involves a groovy analog low pass filter with a few of those stone age capacitors. Its job is to remove as much as possible of any frequencies higher than the Nyquist frequency so that aliasing does not occur. But to achieve exactly that, is a challenge worthy of second thought because an analog filter introduces phase distortion, setting pass-band frequencies back in time relative to higher frequencies. In serious cases this makes a dull sound that is displeasing to the human ear. Old audio equipment was rife with this problem. Moreover, the greater the Q factor (ie: the greater the slope in a filter's response level vs. frequency) the greater the phase effect. Early implementations of digital recording featured filters with very high Q factors. These were known as brickwall filters, but they produced harsh and displeasing results. Because phase distortion is simply unavoidable in analog filtering, this presents a need for a trade-off between an acceptable level of distortion and an acceptable level of aliasing.
One possible answer to this problem is to introduce a second analog stage, known as a time correction filter. This returns the incoming soundwave to a phase-linear state, and to a shape reasonably similar to the original. Another is to sample at a much higher frequency than is required for input. The filter may then be made with a lower Q factor, and so, when the actual data file is sampled or averaged (at a divisor frequency) out of the original samples, there will have been far less aliasing and far less phase distortion. This is one of the advantages of oversampling.
Oversampling
Oversampling in its theoretical form goes back to the 1950's, but it was not perfected until decades later. It usually involves sampling - for recording or playback - in two stages. Every ADC and DAC maker has its own patent technique and the details, though available, are way beyond the scope of this article. All techniques, however, can be classified according to the following two categories: Firstly, multi-bit oversampling, as developed by Phillips for the CD player, and secondly, 1 bit (or Bitstream) oversampling.
Whereas multi-bit oversampling uses a full-width sample for each and every sample (eg: 16 bits), and may feature multiple times oversampling (multiples of 2), 1-bit oversampling uses a single bit sample, but at a much higher oversampling rate - as much as 64 or 128 times. Some of the patent methods, however, use both methods, performing multi-bit oversampling first, then converting that data to a single bit stream, and then oversampling that again.
The 1-bit converters take advantage of a theoretical principal that to sample frequently at a low bit-resolution yields the same result as sampling less frequently at a high bit-resolution. That is, to sample with 1 bit, 16 times in a period, is as good as sampling with 16 bits once only in the same period. The same amount of information is generated. By this means, the data is spread efficiently across the time domain rather than stacked inefficiently with each sample showing completely what the power level is. This explanation is only applicable, precisely as stated, to the simplest of converters. Some use several stages of oversampling and a number of different sample widths (numbers of bits per sample) in the oversampling processes.
As we noted above, one reason for using oversampling is to allow for an antialising filter whose Q factor is low enough to maintain reasonable phase linearity. The opportunity to perform digital filtering also presents itself rather temptingly, as it is possible to filter a digital signal without phase distortion. Another reason is to reduce quantisation noise, also looked at above as effects on the high treble band. The amount of digital quantisation noise present in a recording is directly proportional to the bits-per-sample resolution. The amount does not vary according to the sampling rate, or to any other factor (A higher sampling rate only moves the dominant part of quantisation noise up to a higher frequency band). This noise, in fact, spreads out across the entire spectrum. Thus, when the spectrum is reduced, such as through resampling a data file out of an oversampled signal, the signal to noise ratio increases. A recording that was created with 4 times oversampling features 6 dB less quantisation noise than the oversampled copy, and at 8 times oversampling, the noise is 12 dB lower.
Converter Linearity
Two of the problems facing digital audio technology have more to do with hardware than mathematics and software. What we refer to by converter linearity is the consistency of the converter's function. The length of sample periods tends to vary a little, as does the realisation of the power level of individual samples. Thus, the shape of the output wave fluctuates minutely in comparison to the digital source. A converter's specifications may then be dualised with a statement like: "18 bits, 16 bit linear". The linear resolution figure tells you more than the total resolution figure in regard to the functional quality of the converter.

A sine wave at R(Nq), at 90 degrees phase. In a steady-state wave this frequency may only assume its proper amplitude when peaks align with samples, as shown. In other circumstances this effect may be mollified in the audio output.
A sine wave at the R(Nq), at 0 degrees phase.

A sine wave at the R(Nq), at 45 degrees phase. Actual amplitude is 0 dB, whereas the apparent amplitude is -3.01 dB.

A sine wave at 21 kHz, sampled at 44.1 kHz. Phase relationship between wave and samples is 90 degrees.

A square wave at 1 kHz. Note the line which extends beyond the 16 bit range for sample values. This line approximates the action of a smoothing filter.

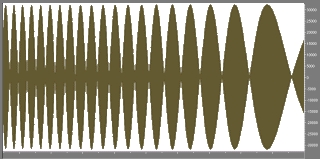
Last 100ms of a sine wave glissando rising to R(Nq). The undulations represent the misalignment of samples to actual peaks. However, in this instance, a close-up in a wave editor would reveal a sinusoidal wave, with a near-constant amplitude, and which would approximate the audio output.
